Even though I started investing in my Roth IRA when I began my first “real job” in 2015, I just recently started tracking my performance.
While index funds comprise my Roth 401(k)s, HSAs, and other accounts, my Roth IRA portfolio consists of individual stocks. As I have gotten more serious about my financial journey over the last several months, I wondered how my stock picking performance stacked up to the market’s performance.
Therefore, I initiated the steps to assess my performance relative to the market.
Since this is my first post on my Roth portfolio, I provide some general background information on my game plan and strategy prior to discussing my individual stock picks and performance.
My Overall Game Plan
I enjoy picking and monitoring individual stocks. For me, the returns far exceed just the financial gains.
By picking individual companies, I learn much more about business, economics, and the individual markets in which my companies operate. I feel ownership and pride when I utilize the services offered by the companies in which I own shares. Additionally, picking individual companies allows me to converse with other individuals and mentors who have similar interests as me. The ability to seem knowledgeable and confident allows me to exceed in my professional life and build relationships with other investors.
While I certainly enjoy picking individual stocks, my primary purpose in investing centers around accumulating wealth to achieve financial independence. Therefore, if my stock picks do not outperform the returns from a broad-based S&P 500 index fund over the long run, my strategy may shift to employing more indexing and less individual stock picks with only “fun money.”
After all, if I underperform the S&P 500, I could potentially lose hundreds of thousands of dollars in opportunity cost over my multi-decade time horizon. Therefore, I now monitor my performance closely to ensure I maximize my wealth-building capacity.
My Investing Strategy
Because I am a young investor in my mid-20s, I invest as though I do not need the money for 40 plus years.
This long time horizon allows me to be more aggressive and take more risk in my portfolio allocation. However, I stay far away from extremely speculative “investments” such as cryptocurrency or cannabis stocks in my Roth IRA. While I may experience larger unrealized losses when the market declines compared to the market averages, I should be compensated for the increased risk in my portfolio’s long-term returns. However, achieving these greater returns could take multiple years to come to fruition.
When I first started picking individual stocks, my strategy consisted of buying blue chip, dividend paying stocks. In line with the value investing philosophy, I sought out stocks that I believed to be undervalued relative to their true, “intrinsic value.” While this strategy provides reliable income and less volatility overall, I found myself drastically underperforming the overall market.
However, now my portfolio primarily consists of growth-oriented stocks centered in the technology sector. These companies typically lead their respective industries and embody innovation and market dominance which may allow for long-term outperformance.
As my time horizon steadily declines, I plan to allocate a greater percentage of my portfolio to more mature companies that pay dividends and offer more stability. Additionally, as I plan to hold these stocks for the long run, many the companies in my portfolio may develop into the next “blue chip” stock or begin paying or increasing dividends.
How I Track My Performance
Every month, I track my monthly expenses and ensure my spending aligns with my budget in Personal Capital and Microsoft Excel. As a part of this process, I also aggregate all of my banking and investment accounts in order to determine my overall net worth in Excel.
I primarily use Personal Capital to automatically aggregate my balances so I can monitor my accounts on an ongoing basis.
For my Roth IRA, I maintain a separate spreadsheet tab outlining each stock I own, the date of purchase, number of shares, and purchase price.
Simultaneously, I mark where the S&P 500 trades each time I make a new stock purchase. In my spreadsheet, I calculate the increase or decrease of the stock as well as the percentage change of the S&P 500. This allows me to calculate how much money I would have if I had invested in the S&P 500 versus buying that particular stock.
At the end of the month, I now have a running tally of my stock performance as well as hypothetical returns that I would have achieved if I had bought an S&P 500 index fund. This provides valuable information that helps me determine if my stock picks have been successful or duds compared to a benchmark.
By comparing the returns of my stocks to the S&P 500, I clearly see which stocks beat the index and which stocks underperformed.
Weighting My Portfolio
One step further, I then “weight” my portfolio returns to ensure a more accurate picture of my performance. If I did not weight my portfolio, the overall returns would be misleading and not representative of how my stocks performed.
As an example, let’s say I had a $100,000 in cash I wanted to invest. In this example, I buy $20,000 of stock in Company ABC and $80,000 in Company XYZ. Clearly, my portfolio weighting largely consists of Company XYZ.
However, let’s say I did not weight my portfolio and Company ABC returned 50% and Company XYZ returned 0%. My average, unweighted returns come out to 25% which clearly cannot be true given most of the portfolio consists of a stock that returned nothing in a given year.
In order to offer a more realistic picture of my returns, I take the percentage Company ABC represents of the entire portfolio (20%) and multiply that amount by Company ABC’s 50% return. Similarly, I repeat the process for Company XYZ.
Therefore, the equation looks like this: (Company ABC = 20% x 50%) + (Company XYZ = 80% x 0%). The weighted-average returns for this hypothetical portfolio would be 10%.
I then calculate how this return compares to the S&P 500 over the same time period.
In a perfect world, each of my stocks would comprise an equal-weighting in my portfolio and this step would not be necessary. However, I believe in certain companies more than others and allocate a greater amount to these companies I think will outperform. Additionally, as the returns compound and the market value changes, I must continually adjust my weighted returns.
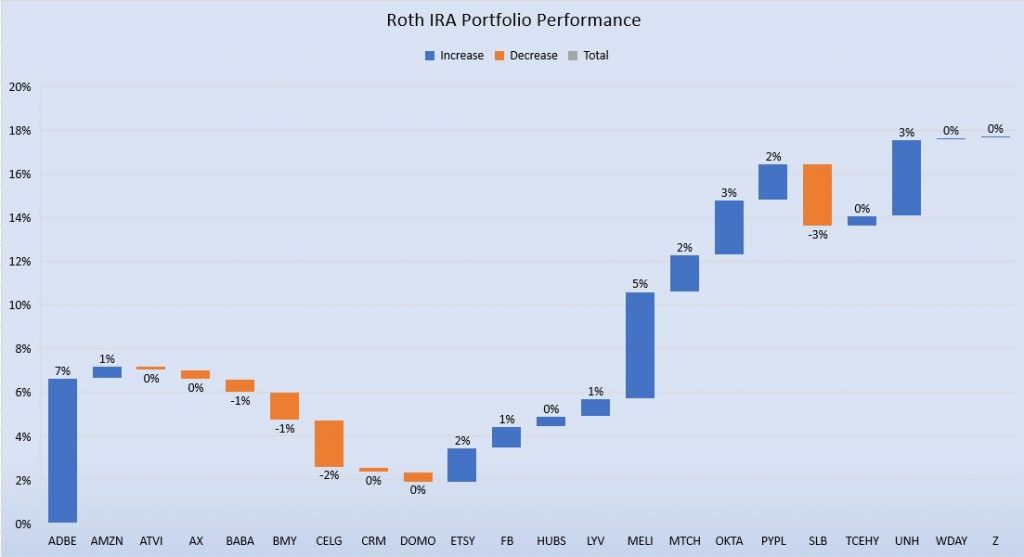
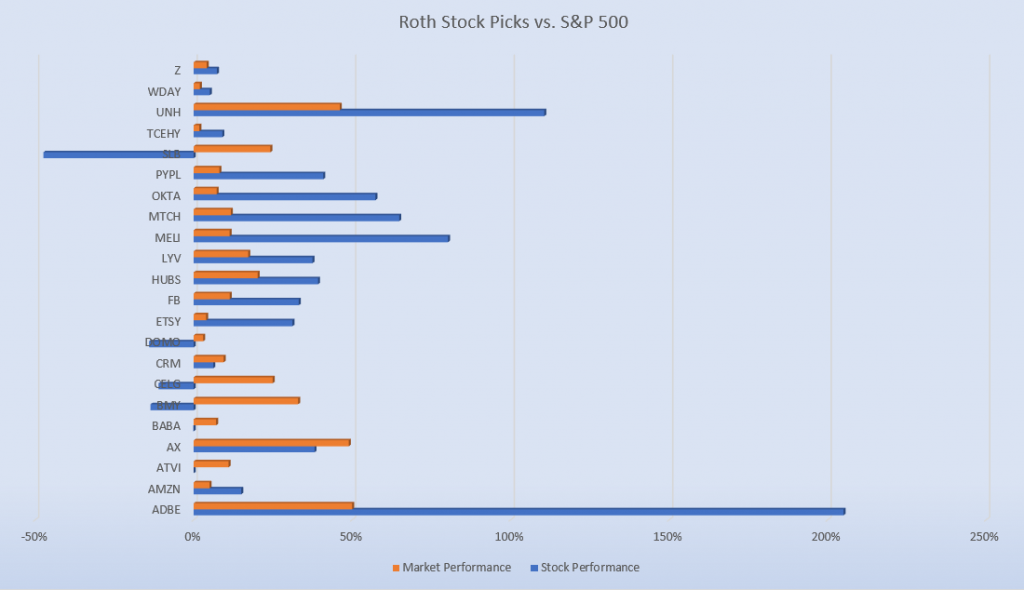
My Roth IRA Portfolio as of 6/30/2019 vs. S&P 500:
Adobe (ADBE):
Percentage of Portfolio: 4%
Performance vs. S&P 500: +155%
Weighted Performance: +7%
Amazon (AMZN):
Percentage of Portfolio: 6%
Performance vs. S&P 500: +10%
Weighted Performance: +1%
Activision Blizzard (ATVI):
Percentage of Portfolio: 2%
Performance vs. S&P 500: -11%
Weighted Performance: 0%
Axos Financial (AX):
Percentage of Portfolio: 4%
Performance vs. S&P 500: -11%
Weighted Performance: 0%
Alibaba Group (BABA):
Percentage of Portfolio: 8%
Performance vs. S&P 500: -7%
Weighted Performance: -1%
Bristol-Myers Squibb (BMY):
Percentage of Portfolio: 3%
Performance vs. S&P 500: -47%
Weighted Performance: -1%
Celgene (CELG):
Percentage of Portfolio: 6%
Performance vs. S&P 500: -36%
Weighted Performance: -2%
Salesforce.com (CRM):
Percentage of Portfolio: 7%
Performance vs. S&P 500: -3%
Weighted Performance: 0%
DOMO, Inc (DOMO):
Percentage of Portfolio: 3%
Performance vs. S&P 500: -17%
Weighted Performance: 0%
Etsy (ETSY):
Percentage of Portfolio: 6%
Performance vs. S&P 500: +27%
Weighted Performance: +2%
Facebook (FB):
Percentage of Portfolio: 5%
Performance vs. S&P 500: +22%
Weighted Performance: +1%
Hubspot (HUBS):
Percentage of Portfolio: 2%
Performance vs. S&P 500: +19%
Weighted Performance: +0%
Live Nation Entertainment (LYV):
Percentage of Portfolio: 4%
Performance vs. S&P 500: +20%
Weighted Performance: +1%
Mercadolibre (MELI):
Percentage of Portfolio: 7%
Performance vs. S&P 500: +72%
Weighted Performance: +5%
Match Group (MTCH):
Percentage of Portfolio: 3%
Performance vs. S&P 500: +53%
Weighted Performance: +2%
Okta (OKTA):
Percentage of Portfolio: 5%
Performance vs. S&P 500: +50%
Weighted Performance: +3%
PayPal (PYPL):
Percentage of Portfolio: 5%
Performance vs. S&P 500: +33%
Weighted Performance: +2%
Schlumberger (SLB):
Percentage of Portfolio: 4%
Performance vs. S&P 500: -72%
Weighted Performance: -3%
Tencent Holdings (TCEHY):
Percentage of Portfolio: 6%
Performance vs. S&P 500: +7%
Weighted Performance: 0%
UnitedHealth Group (UNH):
Percentage of Portfolio: 5%
Performance vs. S&P 500: +65%
Weighted Performance: +3%
Workday (WDAY):
Percentage of Portfolio: 2%
Performance vs. S&P 500: +5%
Weighted Performance: 0%
Zillow (Z):
Percentage of Portfolio: 3%
Performance vs. S&P 500: +3%
Weighted Performance: 0%
Roth IRA Portfolio Summary
Overall, my portfolio outperformed the market by 18% since 2015.
My Winning Stock Picks
My largest relative winners come from 3 stocks that I initially purchased in 2015 – UnitedHealth Group (UNH), Mercadolibre (MELI), and Adobe Systems (ADBE). Because these stocks have the longest time period to compound, they make up a larger percentage of my overall and weighted-average returns.
The next 5 winning stocks of PayPal, Okta, Match Group, Hubspot, and Etsy all represent recent purchases in the last year as my strategy shifted to growth-oriented companies. As these stocks continue to outperform, I fully expect these companies to add considerably more cushion to my portfolio’s outperformance.
My Losing Stock Picks
While my losing stock picks bring down my performance considerably, these companies also offered valuable learning lessons that resulted in my strategy shift.
When I first started investing, I looked for “cheap” companies to buy. Often, I found these companies on the 52 week low list or in industries that had been pummeled. As these underperformers continued to decline, I continued purchasing more to average down my cost basis.
In essence, I tried to “catch a falling knife” and attempted to pick up many of these companies at the bottom of the market. However, this strategy clearly failed.
My largest relative losers consist of Schlumberger, Celgene, and Bristol-Myers Squibb.
I continue to hold Schlumberger because I desire exposure to the cyclical oil and gas industry with a large, dividend-paying player. Obviously, I believed in the recovery of the oil and gas market way too soon and thought this bellwether stood a much larger chance of holding up under the tough conditions. Clearly, my thesis did not come to fruition.
As of Q2 2019, Bristol-Myers Squibb and Celgene have current plans to merge. While I owned both Bristol-Myers Squibb and Celgene prior to the announced merger, I still believe in the long-term prospects of the combined companies. Therefore, I plan to continue holding for exposure to the healthcare industry.
My Picks vs. The Market:
My Future Plans for My Roth IRA Portfolio
While I am pleased with my portfolio’s overall performance, I plan to make adjustments in 2020 when I contribute more money into my Roth IRA.
Currently, my portfolio largely consists of higher growth, technology plays. Because I believe in the companies’ growth prospects longer-term and have a time horizon to accommodate any volatility, I do not have an issue with this portfolio composition. Further, most of my newer positions were initiated in December 2018 and January 2019 when the NASDAQ and S&P 500 experienced significant pullbacks from their highs.
The “bear market” pullback allowed for an opportune buy for many of my now core positions since these companies experienced even greater volatility.
However, while I like the long-term prospects for these tech companies, I would like to add in more healthcare and financial company exposure to round out my holdings.
Companies On My Radar
In the financials sector, I still like the idea of adding companies in cyclical-growth segments of the financial market.
While I currently own stock in an online bank (Axos Financial) and PayPal in my Roth IRA, I like the prospects of some payment processors such as Square (SQ), Mastercard (MA), and Visa (V). Each of these companies continue to grow revenue at double-digit rates as they expand further into other markets.
Often, these companies are so entrenched in our daily lives that the barriers to entry for competitors can be quite fierce. This provides ample moat to protect their competitive advantages in the financial sector.
Within the healthcare industry, I am interested in purchasing stock in drug developers and manufacturers such as Amgen (AMGN) and IDEXX Laboratories (IDEXX). Additionally, I am interested in device manufacturer Intuitive Surgical (ISRG) which develops robotic surgical instruments.
Disclaimer
As always, please remember the stocks in my portfolio do not represent recommendations for you to buy. Because your financial situation may be different and investing involves risk of loss, you should consult with a financial adviser or professional prior to making investment decisions.
Traceview Finance and this article does not offer personal, financial advice specific to your situation and risk tolerance. The information provided should be used as informational and entertainment only.